
Page 31 - Policy Economic Report - June 2024
P. 31
POLICY AND ECONOMIC REPORT
OIL & GAS MARKET
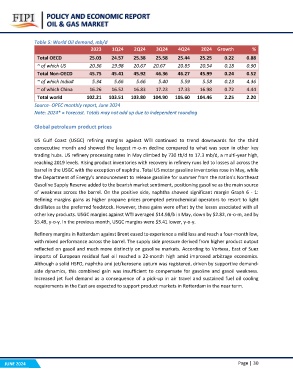
Table 5: World Oil demand, mb/d 2Q24 3Q24 4Q24 2024 Growth %
2023 1Q24
0.88
Total OECD 25.03 24.57 25.38 25.58 25.44 25.25 0.22 0.90
0.52
~ of which US 20.36 19.98 20.67 20.67 20.85 20.54 0.18 4.36
4.44
Total Non-OECD 45.75 45.41 45.92 46.36 46.27 45.99 0.24 2.20
~ of which India# 5.34 5.66 5.66 5.40 5.59 5.58 0.23
~ of which China 16.26 16.52 16.83 17.23 17.33 16.98 0.72
Total world 102.21 103.51 103.80 104.90 105.60 104.46 2.25
Source- OPEC monthly report, June 2024
Note: 2024* = Forecast. Totals may not add up due to independent rounding
Global petroleum product prices
US Gulf Coast (USGC) refining margins against WTI continued to trend downwards for the third
consecutive month and showed the largest m-o-m decline compared to what was seen in other key
trading hubs. US refinery processing rates in May climbed by 730 tb/d to 17.3 mb/d, a multi-year high,
reaching 2019 levels. Rising product inventories with recovery in refinery runs led to losses all across the
barrel in the USGC with the exception of naphtha. Total US motor gasoline inventories rose in May, while
the Department of Energy’s announcement to release gasoline for summer from the nation's Northeast
Gasoline Supply Reserve added to the bearish market sentiment, positioning gasoline as the main source
of weakness across the barrel. On the positive side, naphtha showed significant margin Graph 6 - 1:
Refining margins gains as higher propane prices prompted petrochemical operators to resort to light
distillates as the preferred feedstock. However, these gains were offset by the losses associated with all
other key products. USGC margins against WTI averaged $14.98/b in May, down by $2.82, m-o-m, and by
$5.49, y-o-y. In the previous month, USGC margins were $3.41 lower, y-o-y.
Refinery margins in Rotterdam against Brent eased to experience a mild loss and reach a four-month low,
with mixed performance across the barrel. The supply side pressure derived from higher product output
reflected on gasoil and much more distinctly on gasoline markets. According to Vortexa, East of Suez
imports of European residual fuel oil reached a 22-month high amid improved arbitrage economics.
Although a solid HSFO, naphtha and jet/kerosene upturn was registered, driven by supportive demand-
side dynamics, this combined gain was insufficient to compensate for gasoline and gasoil weakness.
Increased jet fuel demand as a consequence of a pick-up in air travel and sustained fuel oil cooling
requirements in the East are expected to support product markets in Rotterdam in the near term.
JUNE 2024 Page | 30