
Page 20 - Policy Economic Report - September 2024
P. 20
POLICY AND ECONOMIC REPORT
OIL & GAS MARKET
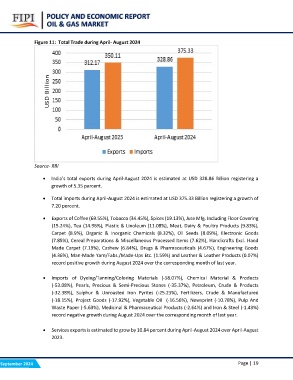
Figure 11: Total Trade during April- August 2024
Source- RBI
• India’s total exports during April-August 2024 is estimated at USD 328.86 Billion registering a
growth of 5.35 percent.
• Total imports during April-August 2024 is estimated at USD 375.33 Billion registering a growth of
7.20 percent.
• Exports of Coffee (69.55%), Tobacco (34.45%), Spices (19.13%), Jute Mfg. Including Floor Covering
(15.24%), Tea (14.96%), Plastic & Linoleum (11.08%), Meat, Dairy & Poultry Products (9.83%),
Carpet (8.9%), Organic & Inorganic Chemicals (8.32%), Oil Seeds (8.09%), Electronic Goods
(7.85%), Cereal Preparations & Miscellaneous Processed Items (7.62%), Handicrafts Excl. Hand
Made Carpet (7.19%), Cashew (6.84%), Drugs & Pharmaceuticals (4.67%), Engineering Goods
(4.36%), Man-Made Yarn/Fabs./Made-Ups Etc. (1.59%) and Leather & Leather Products (0.07%)
record positive growth during August 2024 over the corresponding month of last year.
• Imports of Dyeing/Tanning/Coloring Materials (-58.07%), Chemical Material & Products
(-53.08%), Pearls, Precious & Semi-Precious Stones (-35.37%), Petroleum, Crude & Products
(-32.38%), Sulphur & Unroasted Iron Pyrites (-25.23%), Fertilizers, Crude & Manufactured
(-18.15%), Project Goods (-17.92%), Vegetable Oil (-16.56%), Newsprint (-10.78%), Pulp And
Waste Paper (-5.63%), Medicinal & Pharmaceutical Products (-2.64%) and Iron & Steel (-1.43%)
record negative growth during August 2024 over the corresponding month of last year.
• Services exports is estimated to grow by 10.84 percent during April-August 2024 over April-August
2023.
September 2024 Page | 19