
Page 17 - Policy Economic Report - December 2025
P. 17
POLICY AND ECONOMIC REPORT
OIL & GAS MARKET
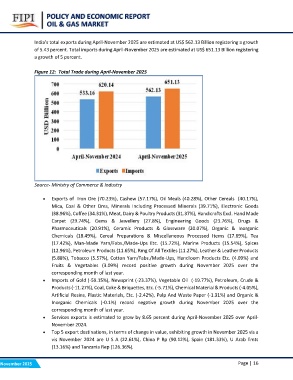
India’s total exports during April-November 2025 are estimated at US$ 562.13 Billion registering a growth
of 5.43 percent. Total imports during April-November 2025 are estimated at US$ 651.13 Billion registering
a growth of 5 percent.
Figure 12: Total Trade during April-November 2025
Source- Ministry of Commerce & Industry
• Exports of Iron Ore (70.23%), Cashew (57.17%), Oil Meals (40.28%), Other Cereals (40.17%),
Mica, Coal & Other Ores, Minerals Including Processed Minerals (39.71%), Electronic Goods
(38.96%), Coffee (34.31%), Meat, Dairy & Poultry Products (31.37%), Handicrafts Excl. Hand Made
Carpet (29.74%), Gems & Jewellery (27.8%), Engineering Goods (23.76%), Drugs &
Pharmaceuticals (20.91%), Ceramic Products & Glassware (20.07%), Organic & Inorganic
Chemicals (18.49%), Cereal Preparations & Miscellaneous Processed Items (17.69%), Tea
(17.42%), Man-Made Yarn/Fabs./Made-Ups Etc. (15.72%), Marine Products (15.54%), Spices
(12.96%), Petroleum Products (11.65%), Rmg Of All Textiles (11.27%), Leather & Leather Products
(5.88%), Tobacco (5.57%), Cotton Yarn/Fabs./Made-Ups, Handloom Products Etc. (4.09%) and
Fruits & Vegetables (3.09%) record positive growth during November 2025 over the
corresponding month of last year.
• Imports of Gold (-59.15%), Newsprint (-23.37%), Vegetable Oil (-19.77%), Petroleum, Crude &
Products (-11.27%), Coal, Coke & Briquettes, Etc. (-5.71%), Chemical Material & Products (-4.05%),
Artificial Resins, Plastic Materials, Etc. (-2.42%), Pulp And Waste Paper (-1.31%) and Organic &
Inorganic Chemicals (-0.1%) record negative growth during November 2025 over the
corresponding month of last year.
• Services exports is estimated to grow by 8.65 percent during April-November 2025 over April-
November 2024.
• Top 5 export destinations, in terms of change in value, exhibiting growth in November 2025 vis a
vis November 2024 are U S A (22.61%), China P Rp (90.12%), Spain (181.33%), U Arab Emts
(13.16%) and Tanzania Rep (126.36%).
November 2025 Page | 16