
Page 19 - Policy & Economic Report - June 2025
P. 19
POLICY AND ECONOMIC REPORT
OIL & GAS MARKET
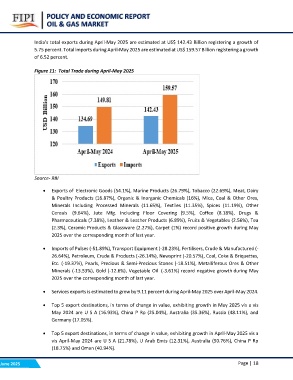
India’s total exports during April-May 2025 are estimated at US$ 142.43 Billion registering a growth of
5.75 percent. Total imports during April-May 2025 are estimated at US$ 159.57 Billion registering a growth
of 6.52 percent.
Figure 11: Total Trade during April-May 2025
June 2025 Source- RBI
• Exports of Electronic Goods (54.1%), Marine Products (26.79%), Tobacco (22.69%), Meat, Dairy
& Poultry Products (16.87%), Organic & Inorganic Chemicals (16%), Mica, Coal & Other Ores,
Minerals Including Processed Minerals (11.65%), Textiles (11.35%), Spices (11.19%), Other
Cereals (9.64%), Jute Mfg. Including Floor Covering (9.5%), Coffee (8.18%), Drugs &
Pharmaceuticals (7.38%), Leather & Leather Products (6.89%), Fruits & Vegetables (2.56%), Tea
(2.3%), Ceramic Products & Glassware (2.27%), Carpet (1%) record positive growth during May
2025 over the corresponding month of last year.
• Imports of Pulses (-51.89%), Transport Equipment (-28.23%), Fertilisers, Crude & Manufactured (-
26.64%), Petroleum, Crude & Products (-26.14%), Newsprint (-20.57%), Coal, Coke & Briquettes,
Etc. (-19.37%), Pearls, Precious & Semi-Precious Stones (-18.51%), Metalliferous Ores & Other
Minerals (-13.53%), Gold (-12.6%), Vegetable Oil (-3.61%) record negative growth during May
2025 over the corresponding month of last year.
• Services exports is estimated to grow by 9.11 percent during April-May 2025 over April-May 2024.
• Top 5 export destinations, in terms of change in value, exhibiting growth in May 2025 vis a vis
May 2024 are U S A (16.93%), China P Rp (25.04%), Australia (35.36%), Russia (48.11%), and
Germany (17.05%).
• Top 5 export destinations, in terms of change in value, exhibiting growth in April-May 2025 vis a
vis April-May 2024 are U S A (21.78%), U Arab Emts (12.31%), Australia (50.76%), China P Rp
(18.75%) and Oman (40.94%).
Page | 18