
Page 38 - Policy Economic Report_Mar'25
P. 38
POLICY AND ECONOMIC REPORT
OIL & GAS MARKET
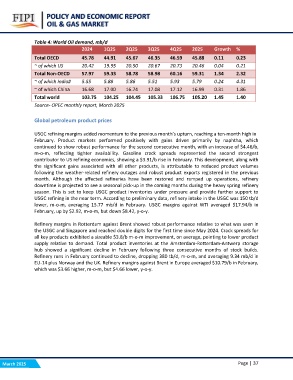
Table 4: World Oil demand, mb/d 2Q25 3Q25 4Q25 2025 Growth %
2024 1Q25
46.35 46.59 45.88 0.11 0.23
Total OECD 45.78 44.91 45.67 20.67 20.73 20.46 0.04 0.21
58.98 60.16 59.31 1.34 2.32
~ of which US 20.42 19.95 20.50 5.51 5.93 5.79 0.24 4.31
17.08 17.12 16.99 0.31 1.86
Total Non-OECD 57.97 59.33 58.78 105.33 106.75 105.20 1.45 1.40
~ of which India# 5.55 5.88 5.86
~ of which China 16.68 17.00 16.74
Total world 103.75 104.25 104.45
Source- OPEC monthly report, March 2025
Global petroleum product prices
USGC refining margins added momentum to the previous month’s upturn, reaching a ten-month high in
February. Product markets performed positively with gains driven primarily by naphtha, which
continued to show robust performance for the second consecutive month, with an increase of $4.46/b,
m-o-m, reflecting tighter availability. Gasoline crack spreads represented the second strongest
contributor to US refining economics, showing a $3.91/b rise in February. This development, along with
the significant gains associated with all other products, is attributable to reduced product volumes
following the weather-related refinery outages and robust product exports registered in the previous
month. Although the affected refineries have been restored and ramped up operations, refinery
downtime is projected to see a seasonal pick-up in the coming months during the heavy spring refinery
season. This is set to keep USGC product inventories under pressure and provide further support to
USGC refining in the near term. According to preliminary data, refinery intake in the USGC was 150 tb/d
lower, m-o-m, averaging 15.77 mb/d in February. USGC margins against WTI averaged $17.94/b in
February, up by $2.92, m-o-m, but down $8.42, y-o-y.
Refinery margins in Rotterdam against Brent showed robust performance relative to what was seen in
the USGC and Singapore and reached double digits for the first time since May 2024. Crack spreads for
all key products exhibited a sizeable $3.8/b m-o-m improvement, on average, pointing to lower product
supply relative to demand. Total product inventories at the Amsterdam-Rotterdam-Antwerp storage
hub showed a significant decline in February following three consecutive months of stock builds.
Refinery runs in February continued to decline, dropping 380 tb/d, m-o-m, and averaging 9.34 mb/d in
EU-14 plus Norway and the UK. Refinery margins against Brent in Europe averaged $10.79/b in February,
which was $3.66 higher, m-o-m, but $4.66 lower, y-o-y.
March 2025 Page | 37