
Page 41 - Policy Economic Report_Mar'25
P. 41
POLICY AND ECONOMIC REPORT
OIL & GAS MARKET
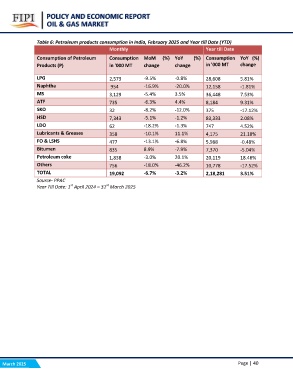
Table 6: Petroleum products consumption in India, February 2025 and Year till Date (YTD)
Monthly Year till Date
Consumption of Petroleum Consumption MoM (%) YoY (%) Consumption YoY (%)
Products (P)
in '000 MT change change in '000 MT change
LPG 2,573 -9.5% -0.8% 28,608 5.81%
-16.9% -20.0% 12,158 -1.81%
Naphtha 954 -5.4% 3.5% 36,448 7.53%
-6.3% 4.4% 8,184 9.31%
MS 3,129 -8.2% -12.0% 375 -17.12%
-5.1% -1.2% 83,333 2.08%
ATF 735 -18.2% -1.3% 747 4.52%
-10.1% 11.1% 4,175 21.18%
SKO 32 -13.1% -6.8% 5,988 -0.48%
8.9% -7.9% 7,370 -5.04%
HSD 7,343 -3.0% 20.1% 20,119 18.46%
-18.0% -46.2% 10,778 -17.52%
LDO 62 -6.7% -3.2% 2,18,281 3.51%
Lubricants & Greases 358
FO & LSHS 477
Bitumen 835
Petroleum coke 1,838
Others 756
TOTAL 19,092
Source- PPAC
Year Till Date: 1st April 2024 – 31st March 2025
March 2025 Page | 40