
Page 32 - FIPI - Policy & Economic Report May 2026
P. 32
POLICY AND ECONOMIC REPORT
OIL & GAS MARKET
Lessons from Economics
Purchasing Managers’ Index
Purchasing Managers’ Index (PMI) is a monthly economic indicator derived from survey responses of
senior purchasing and supply executives across private sector companies. Originally developed in the 1915
by the National Association of Purchasing Management, which is now the Institute for Supply
Management (ISM); the index has since been globalized and standardized by organizations like S&P Global
across more than 40 nations.
As a leading economic indicator, the PMI provides real-time insights into the Manufacturing (factories and
production) and Services (finance, IT, healthcare).
Survey methodology
? The HSBC India Manufacturing PMI is compiled by S&P Global from responses to questionnaires
sent to purchasing managers in a panel of around 400 manufacturers.
? The panel is stratified by detailed sector and company workforce size, based on contributions to
GDP.
? Survey responses are collected in the second half of each month and indicate the direction of
change compared to the previous month.
? A diffusion index is calculated for each survey variable. It is a statistical tool used to aggregate
diverse survey responses into a single number that shows the general direction and rate of change
in the underlying data.
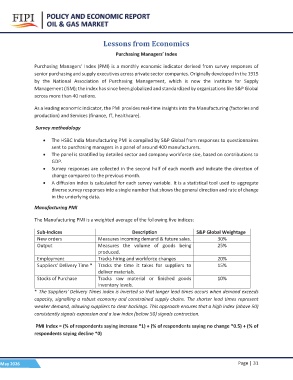
Manufacturing PMI
The Manufacturing PMI is a weighted average of the following five indices:
Sub-Indices Description S&P Global Weightage
New orders
Measures incoming demand & future sales. 30%
Output Measures the volume of goods being 25%
Employment produced. 20%
Tracks hiring and workforce changes
Suppliers’ Delivery Time * Tracks the time it takes for suppliers to 15%
Stocks of Purchase deliver materials. 10%
Tracks raw material or finished goods
inventory levels.
*The Suppliers' Delivery Times index is inverted so that longer lead times occurs when demand exceeds
capacity, signalling a robust economy and constrained supply chains. The shorter lead times represent
weaker demand, allowing suppliers to clear backlogs. This approach ensures that a high index (above 50)
consistently signals expansion and a low index (below 50) signals contraction.
PMI Index = (% of respondents saying increase *1) + (% of respondents saying no change *0.5) + (% of
respondents saying decline *0)
May 2026 Page | 31