Page 33 - Policy Economic Report - April 2026
P. 33

POLICY AND ECONOMIC REPORT
                OIL & GAS MARKET

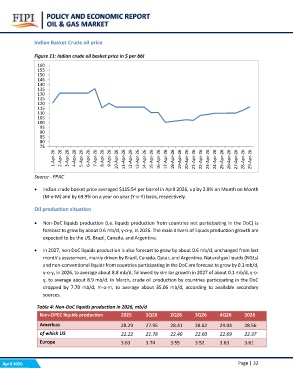
            Indian Basket Crude oil price

            Figure 11: Indian crude oil basket price in $ per bbl

             160
             155
             150
             145
             140
             135
             130
             125
             120
             115
             110
             105
             100

               95
               90
               85
               80
               75

            1-Apr-26
                2-Apr-26
                    3-Apr-26
                         4-Apr-26
                             5-Apr-26
                                  6-Apr-26
                                      7-Apr-26
                                           8-Apr-26
                                               9-Apr-26
                                                    10-Apr-26
                                                        11-Apr-26
                                                             12-Apr-26
                                                                 13-Apr-26
                                                                      14-Apr-26
                                                                          15-Apr-26
                                                                               16-Apr-26
                                                                                   17-Apr-26
                                                                                       18-Apr-26
                                                                                            19-Apr-26
                                                                                                20-Apr-26
                                                                                                     21-Apr-26
                                                                                                         22-Apr-26
                                                                                                              23-Apr-26
                                                                                                                  24-Apr-26
                                                                                                                       25-Apr-26
                                                                                                                           26-Apr-26
                                                                                                                                27-Apr-26
                                                                                                                                    28-Apr-26
                                                                                                                                         29-Apr-26

            Source - PPAC

            • Indian crude basket price averaged $115.54 per barrel in April 2026, up by 2.8% on Month on Month
                (M-o-M) and by 69.9% on a year on year (Y-o-Y) basis, respectively.

            Oil production situation

            • Non-DoC liquids production (i.e. liquids production from countries not participating in the DoC) is
                forecast to grow by about 0.6 mb/d, y-o-y, in 2026. The main drivers of liquids production growth are
                expected to be the US, Brazil, Canada, and Argentina.

            • In 2027, non-DoC liquids production is also forecast to grow by about 0.6 mb/d, unchanged from last
                month’s assessment, mainly driven by Brazil, Canada, Qatar, and Argentina. Natural gas liquids (NGLs)
                and non-conventional liquids from countries participating in the DoC are forecast to grow by 0.1 mb/d,
                y-o-y, in 2026, to average about 8.8 mb/d, followed by similar growth in 2027 of about 0.1 mb/d, y-o-
                y, to average about 8.9 mb/d. In March, crude oil production by countries participating in the DoC
                dropped by 7.70 mb/d, m-o-m, to average about 35.06 mb/d, according to available secondary
                sources.

            Table 4: Non-DoC liquids production in 2026, mb/d

            Non-OPEC liquids production  2025   1Q26               2Q26   3Q26   4Q26   2026

            Americas                     28.29  27.95              28.41  28.82  29.04  28.56
            of which US                  22.22  21.78              22.40  22.60  22.69  22.37
            Europe                       3.63   3.74               3.55   3.52   3.63   3.61

April 2026                                                                              Page | 32
   28   29   30   31   32   33   34   35   36   37   38