
Page 40 - Policy Economic Report - April 2026
P. 40
7.26POLICY AND ECONOMIC REPORT6.9310.046.897.02 6.99 6.96 6.55 6.48 6.25 6.21 6.81 10.76
10.04OIL & GAS MARKET10.04 10.04 10.04 10.04 9.72 9.72 9.72 9.72 9.72 9.72 8.90
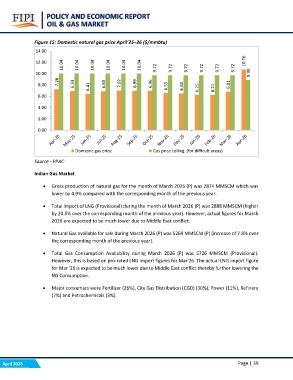
Figure 15: Domestic natural gas price April’25–26 ($/mmbtu)6.41
14.00
12.00
10.00
8.00
6.00
4.00
2.00
0.00
Domestic gas price Gas price ceiling (for difficult areas)
Source - PPAC
Indian Gas Market
• Gross production of natural gas for the month of March 2026 (P) was 2874 MMSCM which was
lower by 4.9% compared with the corresponding month of the previous year.
• Total Import of LNG (Provisional) during the month of March 2026 (P) was 2888 MMSCM (higher
by 20.5% over the corresponding month of the previous year). However, actual figures for March
2026 are expected to be much lower due to Middle East conflict.
• Natural Gas available for sale during March 2026 (P) was 5269 MMSCM (P) (increase of 7.8% over
the corresponding month of the previous year).
• Total Gas Consumption Availability during March 2026 (P) was 5726 MMSCM (Provisional).
However, this is based on pro-rated LNG Import figures for Mar'26. The actual LNG Import figure
for Mar '26 is expected to be much lower due to Middle East conflict thereby further lowering the
NG Consumption.
• Major consumers were Fertilizer (26%), City Gas Distribution (CGD) (30%), Power (11%), Refinery
(7%) and Petrochemicals (3%).
April 2026 Page | 39