


Page 30 - Policy Economic Report -August 2026
P. 30
POLICY AND ECONOMIC
    OIL & GAS MARKET

at US$80.14 billion, registering a growth of 13.31 per cent over US$70.72 billion in July 2025. Total imports
increased at a faster pace to US$95.16 billion, compared with US$82.16 billion a year earlier, representing
a growth of 15.83 per cent. As a result, the overall trade deficit widened to US$15.03 billion during July
2026 from US$11.43 billion in July 2025. During the first four months of FY 2026–27 (April–July),
cumulative exports increased by 13.16 per cent to US$316.42 billion, while imports rose by 17.28 per
cent to US$365.85 billion.

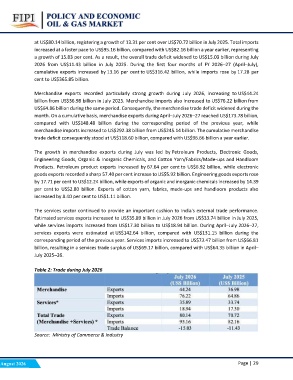
Merchandise exports recorded particularly strong growth during July 2026, increasing to US$44.24
billion from US$36.98 billion in July 2025. Merchandise imports also increased to US$76.22 billion from
US$64.86 billion during the same period. Consequently, the merchandise trade deficit widened during the
month. On a cumulative basis, merchandise exports during April–July 2026–27 reached US$173.78 billion,
compared with US$148.48 billion during the corresponding period of the previous year, while
merchandise imports increased to US$292.38 billion from US$245.14 billion. The cumulative merchandise
trade deficit consequently stood at US$118.60 billion, compared with US$96.66 billion a year earlier.

The growth in merchandise exports during July was led by Petroleum Products, Electronic Goods,
Engineering Goods, Organic & Inorganic Chemicals, and Cotton Yarn/Fabrics/Made-ups and Handloom
Products. Petroleum product exports increased by 67.64 per cent to US$6.92 billion, while electronic
goods exports recorded a sharp 57.40 per cent increase to US$5.92 billion. Engineering goods exports rose
by 17.71 per cent to US$12.24 billion, while exports of organic and inorganic chemicals increased by 14.39
per cent to US$2.80 billion. Exports of cotton yarn, fabrics, made-ups and handloom products also
increased by 8.40 per cent to US$1.11 billion.

The services sector continued to provide an important cushion to India's external trade performance.
Estimated services exports increased to US$35.89 billion in July 2026 from US$33.74 billion in July 2025,
while services imports increased from US$17.30 billion to US$18.94 billion. During April–July 2026–27,
services exports were estimated at US$142.64 billion, compared with US$131.15 billion during the
corresponding period of the previous year. Services imports increased to US$73.47 billion from US$66.81
billion, resulting in a services trade surplus of US$69.17 billion, compared with US$64.35 billion in April–
July 2025–26.

Table 2: Trade during July 2026

                   Source: Ministry of Commerce & Industry  Page | 29

August 2026

