


Page 31 - Policy Economic Report -August 2026
P. 31
POLICY AND ECONOMIC
                 OIL & GAS MARKET

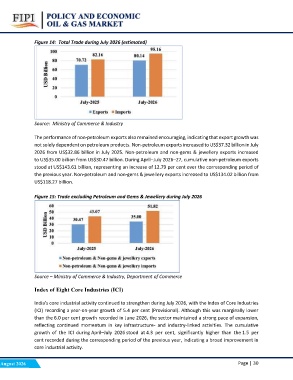
             Figure 14: Total Trade during July 2026 (estimated)

             Source: Ministry of Commerce & Industry

             The performance of non-petroleum exports also remained encouraging, indicating that export growth was
             not solely dependent on petroleum products. Non-petroleum exports increased to US$37.32 billion in July
             2026 from US$32.86 billion in July 2025. Non-petroleum and non-gems & jewellery exports increased
             to US$35.00 billion from US$30.47 billion. During April–July 2026–27, cumulative non-petroleum exports
             stood at US$143.61 billion, representing an increase of 12.79 per cent over the corresponding period of
             the previous year. Non-petroleum and non-gems & jewellery exports increased to US$134.02 billion from
             US$118.27 billion.

             Figure 15: Trade excluding Petroleum and Gems & Jewellery during July 2026

             Source – Ministry of Commerce & Industry, Department of Commerce

             Index of Eight Core Industries (ICI)

             India's core industrial activity continued to strengthen during July 2026, with the Index of Core Industries
             (ICI) recording a year-on-year growth of 5.4 per cent (Provisional). Although this was marginally lower
             than the 6.0 per cent growth recorded in June 2026, the sector maintained a strong pace of expansion,
             reflecting continued momentum in key infrastructure- and industry-linked activities. The cumulative
             growth of the ICI during April–July 2026 stood at 4.3 per cent, significantly higher than the 1.5 per
             cent recorded during the corresponding period of the previous year, indicating a broad improvement in
             core industrial activity.

August 2026                                                       Page | 30

