


Page 51 - Policy Economic Report -August 2026
P. 51
POLICY AND ECONOMIC
             OIL & GAS MARKET

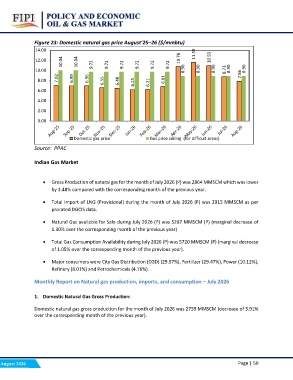
             Figure 23: Domestic natural gas price August’25–26 ($/mmbtu)

             14.00
             12.00
             10.00

               8.00
               6.00
               4.00
               2.00
               0.00
             7.02
               10.04

                      6.99
                         10.04

                                6.96
                                   9.72

                                          6.55
                                            9.72

                                                   6.48
                                                      9.72

                                                             6.25
                                                                9.72

                                                                       6.21
                                                                         9.72

                                                                                6.81
                                                                                   9.72
                                                                                          10.76

                                                                                             8.90
                                                                                                    11.59

                                                                                                       8.90
                                                                                                              10.93

                                                                                                                8.90
                                                                                                                       8.73
                                                                                                                          8.90
                                                                                                                                 7.86
                                                                                                                                    8.90

                                     Domestic gas price  Gas price ceiling (for difficult areas)

             Source: PPAC

             Indian Gas Market

                 • Gross Production of natural gas for the month of July 2026 (P) was 2864 MMSCM which was lower
                      by 3.48% compared with the corresponding month of the previous year.

                 • Total Import of LNG (Provisional) during the month of July 2026 (P) was 2915 MMSCM as per
                      prorated DGCIS data.

                 • Natural Gas available for Sale during July 2026 (P) was 5287 MMSCM (P) (marginal decrease of
                      1.30% over the corresponding month of the previous year)

                 • Total Gas Consumption Availability during July 2026 (P) was 5720 MMSCM (P) (marginal decrease
                      of 1.05% over the corresponding month of the previous year).

                 • Major consumers were City Gas Distribution (CGD) (29.57%), Fertilizer (29.47%), Power (10.12%),
                      Refinery (8.01%) and Petrochemicals (4.76%).

             Monthly Report on Natural gas production, imports, and consumption – July 2026

             1. Domestic Natural Gas Gross Production:

             Domestic natural gas gross production for the month of July 2026 was 2759 MMSCM (decrease of 3.91%
             over the corresponding month of the previous year).

August 2026                                                                                       Page | 50

