


Page 48 - Policy Economic Report -August 2026
P. 48
POLICY AND ECONOMIC
             OIL & GAS MARKET

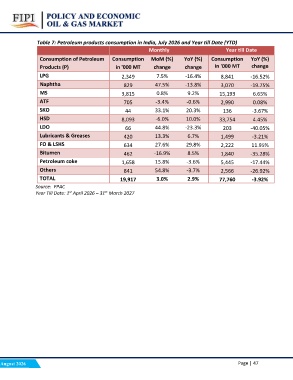
             Table 7: Petroleum products consumption in India, July 2026 and Year till Date (YTD)

                                                               Monthly          Year till Date

             Consumption of Petroleum Consumption MoM (%)               YoY (%) Consumption YoY (%)
                                                                        change in '000 MT change
             Products (P)          in '000 MT change

             LPG 2,349                                          7.5%    -16.4%  8,841              -16.52%
                                                               47.5%    -13.8%  3,070              -19.75%
             Naphtha               829                          0.8%     9.2%   15,193              6.65%
                                                               -3.4%    -0.6%   2,990               0.08%
             MS 3,815                                          33.1%    20.3%    136               -3.67%
                                                               -6.0%    10.0%   33,754              4.45%
             ATF 705                                           44.8%    -23.3%   203               -40.05%
                                                               13.3%     6.7%   1,499              -3.21%
             SKO 44                                            27.6%    29.8%   2,222              11.95%
                                                               -16.9%    8.5%   1,840              -35.28%
             HSD 8,093                                         15.8%    -3.6%   5,445              -17.44%
                                                               54.8%    -3.7%   2,566              -26.92%
             LDO 66                                             3.0%     2.9%   77,760             -3.92%

             Lubricants & Greases  420

             FO & LSHS             634

             Bitumen               462

             Petroleum coke        1,658

             Others                841

             TOTAL                 19,917

             Source: PPAC
             Year Till Date: 1st April 2026 – 31st March 2027

August 2026                                                                                        Page | 47

