
Page 25 - Policy Economic Report_Jan 25
P. 25
POLICY AND ECONOMIC REPORT
OIL & GAS MARKET
In the above figure, countries are ranked based on their daily mean per capita income or consumption
(left axis) and the Prosperity Gap (right axis). If countries had the same level of inequality, both rankings
would align. However, the Prosperity Gap adjusts rankings by penalizing societies with higher inequality
and rewarding those with lower inequality, leading to multiple line crisscrossing in the figure.
For example-: Ghana and Sierra Leone from Sub-Saharan Africa, and Colombia and Peru from Latin
America. On average, Ghana and Colombia are wealthier than Sierra Leone and Peru, respectively.
Nevertheless, the latter pair ranks higher on the Prosperity Gap measure due to their lower levels of
inequality, which more than offset the higher average income of the former countries. In numbers,
Colombia has an average daily per capita income of $17.31, compared to $12.40 in Peru. However, since
inequality in Colombia is 1.8-times higher than the inequality in Peru, Colombia needs an average income
of $22.60 (or 1.8-times higher than Peru’s mean income) for it to have the same Prosperity Gap as Peru.
? Defining a country-relevant prosperity standard
The global prosperity standard of $25/day may be considered for country-specific discussions, particularly
for short-term planning. For instance, based on their most recent household survey, Ethiopia, Ghana, and
Sierra Leone have Prosperity Gaps close to 10. This means that incomes, on average, need to increase
tenfold to meet the $25/day prosperity standard.
A key feature of the Prosperity Gap index is that the prosperity standard only affects the index’s level,
without influencing trends, rankings, or changes over time. As a result, the conclusions drawn from the
exercises above remain unchanged even if a different threshold is applied consistently across all countries.
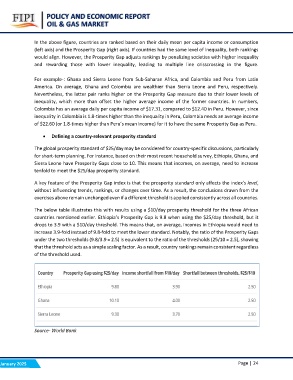
The below table illustrates this with results using a $10/day prosperity threshold for the three African
countries mentioned earlier. Ethiopia’s Prosperity Gap is 9.8 when using the $25/day threshold, but it
drops to 3.9 with a $10/day threshold. This means that, on average, incomes in Ethiopia would need to
increase 3.9-fold instead of 9.8-fold to meet the lower standard. Notably, the ratio of the Prosperity Gaps
under the two thresholds (9.8/3.9 = 2.5) is equivalent to the ratio of the thresholds (25/10 = 2.5), showing
that the threshold acts as a simple scaling factor. As a result, country rankings remain consistent regardless
of the threshold used.
Source- World Bank Page | 24
January 2025