
Page 33 - Policy & Economic Report - June 2025
P. 33
POLICY AND ECONOMIC REPORT
OIL & GAS MARKET
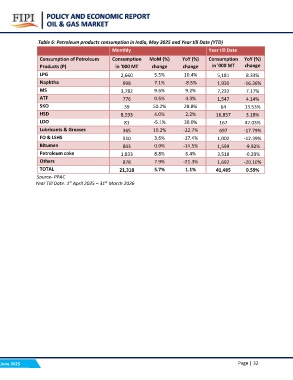
Table 6: Petroleum products consumption in India, May 2025 and Year till Date (YTD)
Monthly Year till Date
Consumption of Petroleum Consumption MoM (%) YoY (%) Consumption YoY (%)
Products (P) in '000 MT change change
change in '000 MT
8.33%
LPG 2,660 5.5% 10.4% 5,181 -16.36%
7.1% -8.5% 1,930 7.17%
Naphtha 998 9.6% 9.2% 7,232 4.14%
0.5% 4.3% 1,547 13.53%
MS 3,782 50.2% 28.8% 3.18%
4.0% 2.2% 64 47.03%
ATF 776 -5.1% 30.0% 16,857 -17.79%
10.2% -22.7% -12.39%
SKO 39 3.6% -17.4% 167 -9.92%
0.9% -14.5% 697 -0.29%
HSD 8,593 8.8% 6.4% 1,002 -20.10%
7.9% -21.3% 1,599 0.59%
LDO 81 5.7% 1.1% 3,518
1,692
Lubricants & Greases 365 41,485
FO & LSHS 510
Bitumen 803
Petroleum coke 1,833
Others 878
TOTAL 21,318
Source- PPAC
Year Till Date: 1st April 2025 – 31st March 2026
June 2025 Page | 32