
Page 30 - FIPI - Policy Economic Report - May 2025
P. 30
POLICY AND ECONOMIC REPORT
OIL & GAS MARKET
Table 4: World Oil demand, mb/d
2024 1Q25 2Q25 3Q25 4Q25 2025 Growth %
Total OECD 45.66 45.16 45.48 46.31 46.08 45.76 0.10 0.23
20.40 20.67 20.72 20.51 0.09 0.43
~ of which US 20.42 20.23 58.77 59.08 60.10 59.24 1.19 2.05
Total Non-OECD 58.05 58.98 5.84 5.50 5.91 5.74 0.19 3.39
16.68 17.03 17.04 16.90 0.25 1.50
~ of which India# 5.55 5.70 104.26 105.39 106.19 105.00 1.30 1.25
~ of which China 16.65 16.86
Total world 103.70 104.14
Source- OPEC monthly report, May 2025
Global petroleum product prices
USGC refining margins against WTI in April rebounded from the previous month’s decline yet settled
below the level registered in February. Most of the improvement was attributed to gasoline as the crack
spreads for the same product showed solid gains for the fourth consecutive month in April. The monthly
rise in April was the largest m-o-m change recorded since January, reflecting the recent maintenance-
related declines in gasoline production. Additionally, the summer-grade gasoline specification switch
further contributed to a slight price rise for the same product in April, while all other products showed a
decline on the back of lower product prices, driving US gasoline margins higher. Moreover, additional
support stemmed from strengthening demand-side factors amid the spring break and ahead of the peak
US driving season.
Refinery margins in Rotterdam against Brent eased further, pressured by a lengthening naphtha balance
as secondary units in Europe underwent maintenance. Moreover, reportedly subdued naphtha-derived
gasoline blending component demand further contributed to the downside. Gasoil was the second
strongest negative performer in Northwest Europe, following naphtha. According to Argus, regional
diesel demand softened due to lower y-o-y diesel car usage and weaker manufacturing activity in most
of the European Union’s major economies, particularly in Germany and Italy.
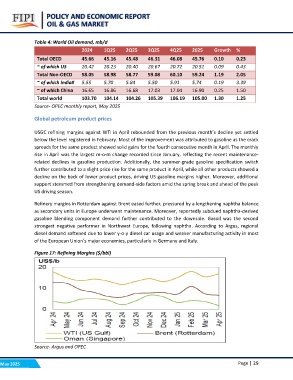
Figure 17: Refining Margins ($/bbl)
Source- Argus and OPEC
May 2025 Page | 29