


Page 24 - Policy Economic Report - September 2026
P. 24
POLICY AND ECONOMIC
    OIL & GAS MARKET

food inflation at 6.13% and urban food inflation at 5.64%. The CFPI index increased from 109.39 in July
to 110.71 in August.
At the division level, personal care, social protection and miscellaneous goods and services recorded the
highest inflation at 15.17%, followed by restaurants and accommodation services at 8.38% and food and
beverages at 5.66%. Transport recorded inflation of 4.60%, while clothing and footwear registered 3.56%.
Inflation in housing, water, electricity, gas and other fuels remained comparatively moderate at 2.61%.
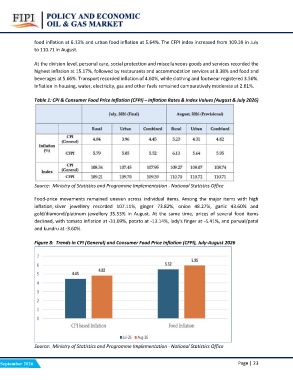
Table 1: CPI & Consumer Food Price Inflation (CFPI) – Inflation Rates & Index Values (August & July 2026)

Source: Ministry of Statistics and Programme Implementation - National Statistics Office
Food-price movements remained uneven across individual items. Among the major items with high
inflation, silver jewellery recorded 107.11%, ginger 73.82%, onion 48.27%, garlic 43.60% and
gold/diamond/platinum jewellery 35.53% in August. At the same time, prices of several food items
declined, with tomato inflation at -31.09%, potato at -13.14%, lady's finger at -5.41%, and parwal/patal
and kundru at -3.60%.
Figure 8: Trends in CPI (General) and Consumer Food Price Inflation (CFPI), July-August 2026

                   Source: Ministry of Statistics and Programme Implementation - National Statistics Office  Page | 23

September 2026

