


Page 26 - Policy Economic Report - September 2026
P. 26
POLICY AND ECONOMIC
    OIL & GAS MARKET

highest rate at 8.10%, followed by Andhra Pradesh at 8.07%, Tamil Nadu at 7.96%, Karnataka at 7.58%
and Telangana at 7.33%.

The August data also indicate a gradual build-up in headline inflation during 2026. All India combined CPI
inflation increased from 2.74% in January to 3.21% in February, 3.40% in March, 3.48% in April, 3.93% in
May, 4.38% in June, 4.45% in July and 4.82% in August. The rural inflation rate has remained consistently
above the urban rate during this period, reaching 5.23% in August compared with 4.31% in urban areas.

Wholesale Prices and Producer Price Indices (Base Year: 2022-23)

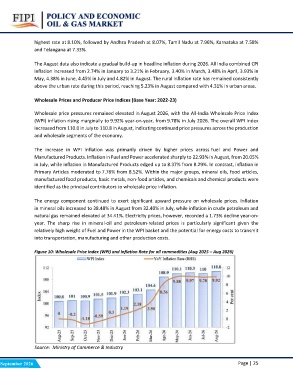
Wholesale price pressures remained elevated in August 2026, with the All-India Wholesale Price Index
(WPI) inflation rising marginally to 9.92% year-on-year, from 9.78% in July 2026. The overall WPI index
increased from 110.0 in July to 110.8 in August, indicating continued price pressures across the production
and wholesale segments of the economy.

The increase in WPI inflation was primarily driven by higher prices across Fuel and Power and
Manufactured Products. Inflation in Fuel and Power accelerated sharply to 22.93% in August, from 20.05%
in July, while inflation in Manufactured Products edged up to 8.37% from 8.29%. In contrast, inflation in
Primary Articles moderated to 7.76% from 8.52%. Within the major groups, mineral oils, food articles,
manufactured food products, basic metals, non-food articles, and chemicals and chemical products were
identified as the principal contributors to wholesale price inflation.

The energy component continued to exert significant upward pressure on wholesale prices. Inflation
in mineral oils increased to 38.48% in August from 32.40% in July, while inflation in crude petroleum and
natural gas remained elevated at 34.41%. Electricity prices, however, recorded a 1.73% decline year-on-
year. The sharp rise in mineral-oil and petroleum-related prices is particularly significant given the
relatively high weight of Fuel and Power in the WPI basket and the potential for energy costs to transmit
into transportation, manufacturing and other production costs.

Figure 10: Wholesale Price Index (WPI) and Inflation Rate for all commodities (Aug 2025 – Aug 2026)

                   Source: Ministry of Commerce & Industry  Page | 25

September 2026

