


Page 32 - Policy Economic Report - September 2026
P. 32
POLICY AND ECONOMIC
                    OIL & GAS MARKET

                2026–27, services exports were estimated at US$183.36 billion, compared with US$162.34 billion during
                the corresponding period of the previous year. Services imports increased to US$96.65 billion from
                US$82.40 billion, resulting in a services trade surplus of US$86.71 billion, compared with US$79.94 billion
                in April–August 2025–26.
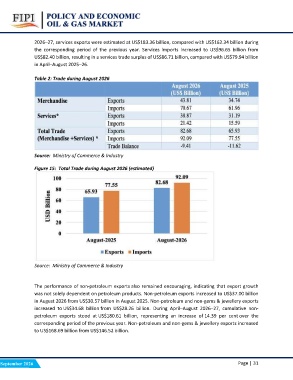
                Table 2: Trade during August 2026

                Source: Ministry of Commerce & Industry
                Figure 15: Total Trade during August 2026 (estimated)

                Source: Ministry of Commerce & Industry

                The performance of non-petroleum exports also remained encouraging, indicating that export growth
                was not solely dependent on petroleum products. Non-petroleum exports increased to US$37.00 billion
                in August 2026 from US$30.57 billion in August 2025. Non-petroleum and non-gems & jewellery exports
                increased to US$34.68 billion from US$28.26 billion. During April–August 2026–27, cumulative non-
                petroleum exports stood at US$180.61 billion, representing an increase of 14.39 per cent over the
                corresponding period of the previous year. Non-petroleum and non-gems & jewellery exports increased
                to US$168.69 billion from US$146.52 billion.

September 2026  Page | 31

