


Page 33 - Policy Economic Report - September 2026
P. 33
POLICY AND ECONOMIC
                    OIL & GAS MARKET

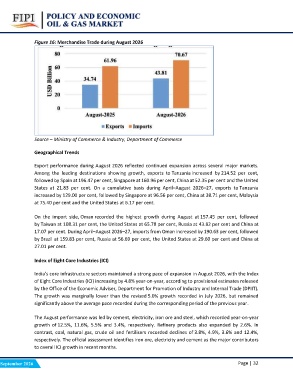
                Figure 16: Merchandise Trade during August 2026

                Source – Ministry of Commerce & Industry, Department of Commerce

                Geographical Trends

                Export performance during August 2026 reflected continued expansion across several major markets.
                Among the leading destinations showing growth, exports to Tanzania increased by 214.52 per cent,
                followed by Spain at 196.47 per cent, Singapore at 160.96 per cent, China at 52.35 per cent and the United
                States at 21.83 per cent. On a cumulative basis during April–August 2026–27, exports to Tanzania
                increased by 129.00 per cent, followed by Singapore at 96.56 per cent, China at 38.71 per cent, Malaysia
                at 75.40 per cent and the United States at 6.17 per cent.

                On the import side, Oman recorded the highest growth during August at 157.45 per cent, followed
                by Taiwan at 108.31 per cent, the United States at 65.78 per cent, Russia at 43.82 per cent and China at
                17.07 per cent. During April–August 2026–27, imports from Oman increased by 190.63 per cent, followed
                by Brazil at 159.83 per cent, Russia at 56.69 per cent, the United States at 29.60 per cent and China at
                27.01 per cent.

                Index of Eight Core Industries (ICI)

                India's core infrastructure sectors maintained a strong pace of expansion in August 2026, with the Index
                of Eight Core Industries (ICI) increasing by 4.8% year-on-year, according to provisional estimates released
                by the Office of the Economic Adviser, Department for Promotion of Industry and Internal Trade (DPIIT).
                The growth was marginally lower than the revised 5.0% growth recorded in July 2026, but remained
                significantly above the average pace recorded during the corresponding period of the previous year.

                The August performance was led by cement, electricity, iron ore and steel, which recorded year-on-year
                growth of 12.5%, 11.6%, 5.5% and 3.4%, respectively. Refinery products also expanded by 2.6%. In
                contrast, coal, natural gas, crude oil and fertilisers recorded declines of 3.8%, 4.9%, 3.6% and 12.4%,
                respectively. The official assessment identifies iron ore, electricity and cement as the major contributors
                to overall ICI growth in recent months.

September 2026                                                   Page | 32

