
Page 35 - Policy Economic Report - April 2025
P. 35
POLICY AND ECONOMIC REPORT
OIL & GAS MARKET
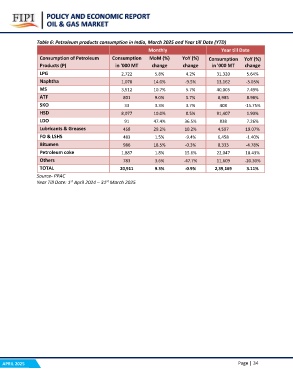
Table 6: Petroleum products consumption in India, March 2025 and Year till Date (YTD)
Monthly Year till Date
Consumption of Petroleum Consumption MoM (%) YoY (%) Consumption YoY (%)
Products (P) in '000 MT change change in '000 MT change
LPG 2,722 5.8% 4.2% 31,320 5.64%
Naphtha 1,078 14.0% -9.5% 13,162 -3.03%
MS 3,512 10.7% 5.7% 40,005 7.49%
ATF 801 9.0% 5.7% 8,985 8.98%
SKO 33 3.3% 3.7% 408 -15.75%
HSD 8,077 10.0% 0.5% 91,407 1.93%
LDO 91 47.4% 36.5% 838 7.26%
Lubricants & Greases 458 29.2% 10.2% 4,597 19.07%
FO & LSHS 483 1.5% -9.4% 6,458 -1.40%
Bitumen 986 18.5% -0.3% 8,333 -4.78%
Petroleum coke 1,887 1.8% 15.6% 22,047 18.43%
Others 783 3.6% -47.7% 11,609 -20.30%
TOTAL 20,911 9.3% -0.9% 2,39,169 3.11%
Source- PPAC
Year Till Date: 1st April 2024 – 31st March 2025
APRIL 2025 Page | 34