
Page 37 - Policy Economic Report - April 2025
P. 37
POLICY AND ECONOMIC REPORT
OIL & GAS MARKET
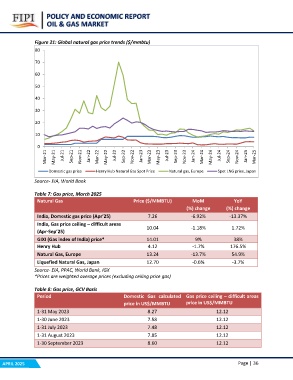
Figure 21: Global natural gas price trends ($/mmbtu)
80
70
60
50
40
30
20
10
0
Mar-21
May-21
Jul-21
Sep-21
Nov-21
Jan-22
Mar-22
May-22
Jul-22
Sep-22
Nov-22
Jan-23
Mar-23
May-23
Jul-23
Sep-23
Nov-23
Jan-24
Mar-24
May-24
Jul-24
Sep-24
Nov-24
Jan-25
Mar-25
Domestic gas price Henry Hub Natural Gas Spot Price Natural gas, Europe Spot LNG price, Japan
Source- EIA, World Bank
Table 7: Gas price, March 2025 Price ($/MMBTU) MoM YoY
Natural Gas (%) change (%) change
India, Domestic gas price (Apr’25) 7.26 -6.92% -13.37%
India, Gas price ceiling – difficult areas 10.04 -1.18% 1.72%
(Apr-Sep’25)
9% 38%
GIXI (Gas index of India) price* 14.01 -1.7% 176.5%
Henry Hub 4.12 -13.7% 54.9%
-0.6% -3.7%
Natural Gas, Europe 13.24
Liquefied Natural Gas, Japan 12.70
Source- EIA, PPAC, World Bank, IGX
*Prices are weighted average prices (excluding ceiling price gas)
Table 8: Gas price, GCV Basis Domestic Gas calculated Gas price ceiling – difficult areas
Period price in US$/MMBTU price in US$/MMBTU
1-31 May 2023 8.27 12.12
1-30 June 2023 7.58 12.12
1-31 July 2023 7.48 12.12
1-31 August 2023 7.85 12.12
1-30 September 2023 8.60 12.12
APRIL 2025 Page | 36