Page 37 - Policy Economic Report - August 2025
P. 37

POLICY AND ECONOMIC REPORT
             OIL & GAS MARKET

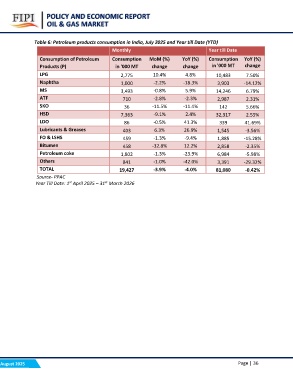
             Table 6: Petroleum products consumption in India, July 2025 and Year till Date (YTD)

                                       Monthly                                  Year till Date

             Consumption of Petroleum  Consumption MoM (%)             YoY (%)  Consumption        YoY (%)
             Products (P)                                              change    in '000 MT        change
                                       in '000 MT              change
                                                                                                    7.50%
             LPG 2,775                                         10.4%    4.8%    10,483             -14.12%
                                                               -2.2%   -18.3%   3,903               6.79%
             Naphtha                   1,000                   -0.8%    5.9%    14,246              2.31%
                                                               -2.8%   -2.3%    2,987               5.66%
             MS 3,493                                          -11.5%  -11.4%    142                2.55%
                                                               -9.1%    2.4%    32,317             41.69%
             ATF 710                                           -0.5%   41.3%     339               -3.56%
                                                                6.3%   26.9%    1,545              -15.28%
             SKO 36                                            -1.3%   -9.4%    1,885              -2.35%
                                                               -32.8%  12.2%    2,858              -5.98%
             HSD 7,363                                         -1.3%   -23.9%   6,984              -29.32%
                                                               -1.0%   -42.0%   3,391              -0.42%
             LDO 86                                            -3.9%   -4.0%    81,080

             Lubricants & Greases      403

             FO & LSHS                 459

             Bitumen                   458

             Petroleum coke            1,802

             Others                    841

             TOTAL                     19,427

             Source- PPAC

             Year Till Date: 1st April 2025 – 31st March 2026

August 2025                                                                                        Page | 36
   32   33   34   35   36   37   38   39   40   41   42