
Page 30 - Policy Economic Report - December 2025
P. 30
POLICY AND ECONOMIC REPORT
OIL & GAS MARKET
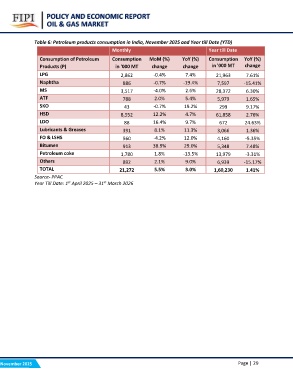
Table 6: Petroleum products consumption in India, November 2025 and Year till Date (YTD)
Monthly Year till Date
Consumption of Petroleum Consumption MoM (%) YoY (%) Consumption YoY (%)
Products (P) in '000 MT change change
change in '000 MT
7.61%
LPG 2,862 -0.4% 7.4% 21,963 -15.41%
-0.7% -19.4% 7,597 6.30%
Naphtha 886 -4.0% 2.6% 28,372 1.65%
2.0% 5.4% 5,979 9.17%
MS 3,517 -0.7% 19.2% 299 2.76%
12.2% 4.7% 61,858 24.63%
ATF 788 16.4% 9.7% 672 1.36%
8.1% 11.3% 3,066 -5.35%
SKO 43 -4.2% 12.0% 4,160 7.48%
38.9% 29.0% 5,348 -3.31%
HSD 8,552 1.8% -13.5% 13,979 -15.17%
2.1% 9.0% 6,939 1.41%
LDO 88 5.5% 3.0% 1,60,230
Lubricants & Greases 391
FO & LSHS 560
Bitumen 913
Petroleum coke 1,780
Others 892
TOTAL 21,272
Source- PPAC
Year Till Date: 1st April 2025 – 31st March 2026
November 2025 Page | 29