


Page 41 - Policy & Economic Report - July 2025
P. 41
POLICY AND ECONOMIC
           ROEILPO&RGTAS MARKET

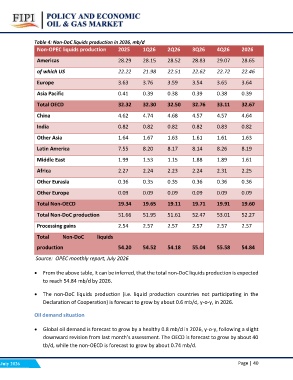
           Table 4: Non-DoC liquids production in 2026, mb/d  2Q26   3Q26   4Q26   2026
            Non-OPEC liquids production 2025 1Q26             28.52  28.83  29.07  28.65
                                                              22.51  22.62  22.72  22.46
           Americas                  28.29 28.15              3.59   3.54   3.65   3.64
                                                              0.38   0.39   0.38   0.39
           of which US               22.22 21.98              32.50  32.76  33.11  32.67
                                                              4.68   4.57   4.57   4.64
           Europe                    3.63 3.76                0.82   0.82   0.83   0.82
                                                              1.63   1.61   1.61   1.63
           Asia Pacific              0.41 0.39                8.17   8.14   8.26   8.19
                                                              1.15   1.88   1.89   1.61
           Total OECD                32.32 32.30              2.23   2.24   2.31   2.25
                                                              0.35   0.36   0.36   0.36
           China                     4.62 4.74                0.09   0.09   0.09   0.09
                                                              19.11  19.71  19.91  19.60
           India                     0.82 0.82                51.61  52.47  53.01  52.27
                                                              2.57   2.57   2.57   2.57
           Other Asia                1.64 1.67
                                                              54.18  55.04  55.58  54.84
           Latin America             7.55 8.20

           Middle East               1.99 1.53

           Africa                    2.27 2.24

           Other Eurasia             0.36 0.35

           Other Europe              0.09 0.09

           Total Non-OECD            19.34 19.65

           Total Non-DoC production  51.66 51.95

           Processing gains          2.54 2.57

           Total Non-DoC liquids

           production                54.20 54.52

           Source: OPEC monthly report, July 2026

           • From the above table, it can be inferred, that the total non-DoC liquids production is expected
               to reach 54.84 mb/d by 2026.

           • The non-DoC liquids production (i.e. liquid production countries not participating in the
               Declaration of Cooperation) is forecast to grow by about 0.6 mb/d, y-o-y, in 2026.

           Oil demand situation

           • Global oil demand is forecast to grow by a healthy 0.8 mb/d in 2026, y-o-y, following a slight
               downward revision from last month’s assessment. The OECD is forecast to grow by about 40
               tb/d, while the non-OECD is forecast to grow by about 0.74 mb/d.

July 2026                                                                          Page | 40

